こんにちは
昨日の記事で、サーバをさくらインターネットVPS内で引っ越ししたと書きました。
この記事です。
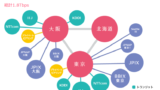
古いサーバは東京リージョンで新しいサーバは石狩リージョンです。
事前に調べた限りでは、東京の方がネットワーク的に良さそうで、CPU的には石狩の方が良さそうな感じです。CPUが新しいって事はメモリなどの速度も全体的に新しいサーバの方が有利なのでは?と思えますが、なんとも分かりません。
せっかく手元に比較できる2台あるので、比較してみました。
比較対象の2台は?
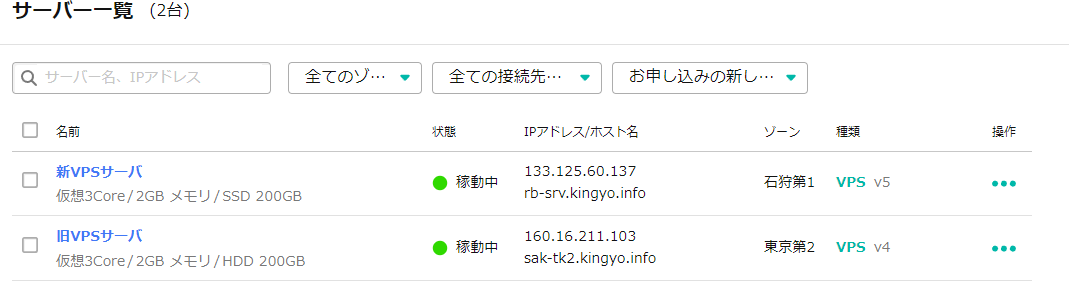
前の記事には、書いてますが。1台は6年半前に契約した東京リージョンのサーバで、もう1台は今月契約した石狩リージョンのサーバです。契約はどちらも同じ3Core、2GBメモリの同スペックの契約です。
こんな感じ。
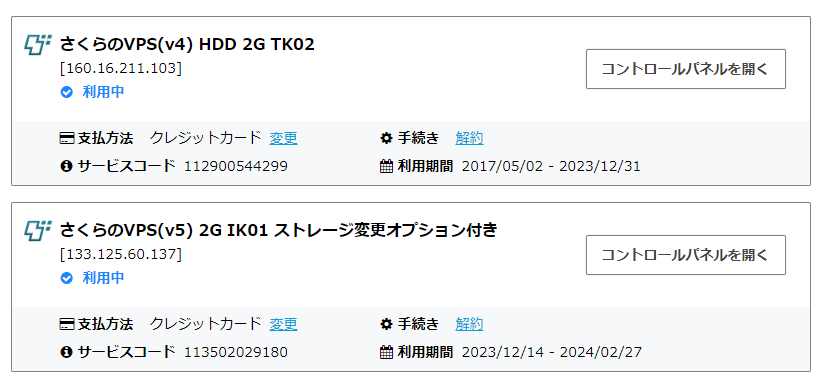
旧サーバがV4、新サーバがV5と書かれています。何が違うのか分かりませんが、おそらく価格などの契約じゃないかと思います。ちなみに最初に契約したのはV2だったと思います。
ネットワークレイテンシーを比較
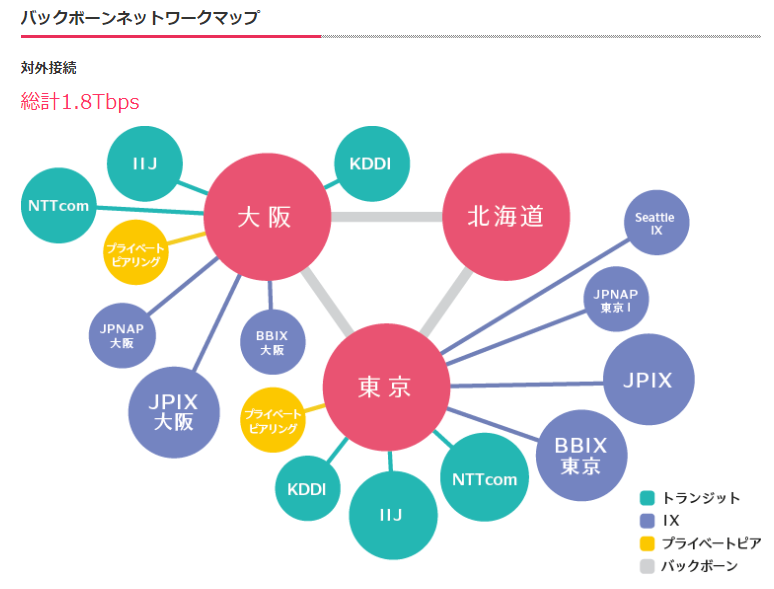
レイテンシーですが、東京のフレッツ光回線の中に設置してあるインターネット環境から計測してみました。
まずは東京リージョンの旧サーバです。
平均は4.3msと、凄い早いです。ここまでなのか。。
平均僅差(mdev)は0.277msと安定していますね。
[ope7@test-srv ~]$ ping -c 5 160.16.211.103
PING 160.16.211.103 (160.16.211.103) 56(84) bytes of data.
64 バイト応答 送信元 160.16.211.103: icmp_seq=1 ttl=54 時間=4.43ミリ秒
64 バイト応答 送信元 160.16.211.103: icmp_seq=2 ttl=54 時間=4.31ミリ秒
64 バイト応答 送信元 160.16.211.103: icmp_seq=3 ttl=54 時間=3.77ミリ秒
64 バイト応答 送信元 160.16.211.103: icmp_seq=4 ttl=54 時間=4.57ミリ秒
64 バイト応答 送信元 160.16.211.103: icmp_seq=5 ttl=54 時間=4.43ミリ秒

--- 160.16.211.103 ping 統計 ---
送信パケット数 5, 受信パケット数 5, 0% packet loss, time 4006ms
rtt min/avg/max/mdev = 3.772/4.302/4.569/0.277 ms
次は新サーバの石狩リージョンです。
平均が21.2msと5倍ぐらいですね。。石狩遠いもんね。。物理的に遠いので仕方ないですね(^_^;
平均僅差(mdev)は0.175msと東京波で、結構安定していますね。
ただ、50ms以下だと早い部類みたいです。比較するとかなり違いますが、どう考えるかですね。
サーバでコマンドを入力してても一切気にならないので、個人的にはありかな。
[ope7@test-srv ~]$ ping -c 5 133.125.60.137
PING 133.125.60.137 (133.125.60.137) 56(84) bytes of data.
64 バイト応答 送信元 133.125.60.137: icmp_seq=1 ttl=53 時間=21.2ミリ秒
64 バイト応答 送信元 133.125.60.137: icmp_seq=2 ttl=53 時間=21.3ミリ秒
64 バイト応答 送信元 133.125.60.137: icmp_seq=3 ttl=53 時間=21.4ミリ秒
64 バイト応答 送信元 133.125.60.137: icmp_seq=4 ttl=53 時間=21.4ミリ秒
64 バイト応答 送信元 133.125.60.137: icmp_seq=5 ttl=53 時間=20.9ミリ秒

--- 133.125.60.137 ping 統計 ---
送信パケット数 5, 受信パケット数 5, 0% packet loss, time 4003ms
rtt min/avg/max/mdev = 20.928/21.230/21.401/0.175 ms
ネットワークの転送速度を計測
レイテンシーも気になりますが、転送速度も気になります。
そもそも移転的には事後なのですが。。(笑)
ベンチマークソフトにiperfを使って測定してみました。
通信元はレイテンシーを計測したのと同じ東京です。
まずは東京リージョンの旧サーバです。2回計測して94.7Mbpsでした。
接続回線が100Mbpsなので、十分出てますね。
[root@test-srv ~]# iperf -c 160.16.211.103
------------------------------------------------------------
Client connecting to 160.16.211.103, TCP port 5001
TCP window size: 85.0 KByte (default)
------------------------------------------------------------
[  1] local 192.168.0.40 port 46138 connected with 160.16.211.103 port 5001
[ ID] Interval       Transfer     Bandwidth
[  1] 0.00-10.12 sec   114 MBytes  94.7 Mbits/sec

[root@test-srv ~]# iperf -c 160.16.211.103
------------------------------------------------------------
Client connecting to 160.16.211.103, TCP port 5001
TCP window size: 85.0 KByte (default)
------------------------------------------------------------
[  1] local 192.168.0.40 port 57064 connected with 160.16.211.103 port 5001
[ ID] Interval       Transfer     Bandwidth
[  1] 0.00-10.14 sec   115 MBytes  94.7 Mbits/sec
次は新サーバの石狩リージョンです。
2回計測して、それぞれ94.0Mbpsと93.9Mbpsでした。東京よりは微妙に落ちますが、誤差レベルかなと思います。正直、もう少し差が出るかなと思ってました。
[root@test-srv ~]# iperf -c 133.125.60.137
------------------------------------------------------------
Client connecting to 133.125.60.137, TCP port 5001
TCP window size: 85.0 KByte (default)
------------------------------------------------------------
[  1] local 192.168.0.40 port 39778 connected with 133.125.60.137 port 5001
[ ID] Interval       Transfer     Bandwidth
[  1] 0.00-10.22 sec   115 MBytes  94.0 Mbits/sec

[root@test-srv ~]# iperf -c 133.125.60.137
------------------------------------------------------------
Client connecting to 133.125.60.137, TCP port 5001
TCP window size: 85.0 KByte (default)
------------------------------------------------------------
[  1] local 192.168.0.40 port 54746 connected with 133.125.60.137 port 5001
[ ID] Interval       Transfer     Bandwidth
[  1] 0.00-10.20 sec   114 MBytes  93.9 Mbits/sec
CPUを見てみた
CPUの種類はお試し期間中に真っ先に確認ています。
まずは東京リージョンの旧サーバです。
CPUは「Intel Core Processor (Broadwell)」でした。参考にしたページの外れ(笑)CPUと同じか。。6年半前でしょ?と思ったんですが、良く考えたら昨年だったかな?(うろ覚え)に、サーバの老朽化でサーバの入れ替えがあったんだった。。あと、HDD→SSDへの変更もあったような。。
そう考えると同じでも違和感無いですね。
この「Intel Core Processor (Broadwell)」ですが、「Xeon E5 v4」との噂があります。
[root@sak-tk2 ~]# cat /proc/cpuinfo
processor       : 0
vendor_id       : GenuineIntel
cpu family      : 6
model           : 61
model name      : Intel Core Processor (Broadwell)
stepping        : 2
microcode       : 0x1
cpu MHz         : 2199.998
cache size      : 4096 KB
physical id     : 0
siblings        : 1
core id         : 0
cpu cores       : 1
apicid          : 0
initial apicid  : 0
fpu             : yes
fpu_exception   : yes
cpuid level     : 13
wp              : yes
flags           : fpu de pse tsc msr pae mce cx8 apic sep mtrr pge mca cmov pat pse36 clflush mmx fxsr sse sse2 syscall nx rdtscp lm constant_tsc rep_good nopl eagerfpu pni pclmulqdq ssse3 fma cx16 pcid sse4_1 sse4_2 x2apic movbe popcnt tsc_deadline_timer aes xsave avx hypervisor lahf_lm 3dnowprefetch invpcid_single rsb_ctxsw fsgsbase bmi1 avx2 smep bmi2 erms invpcid rdseed adx smap xsaveopt
bogomips        : 4399.99
clflush size    : 64
cache_alignment : 64
address sizes   : 46 bits physical, 48 bits virtual
power management:
次は新サーバの石狩リージョンです。
当たりサーバっぽい「Intel(R) Xeon(R) Gold 6212U CPU @ 2.40GHz」です。
[ope@rb-srv ~]$ cat /proc/cpuinfo
processor       : 0
vendor_id       : GenuineIntel
cpu family      : 6
model           : 85
model name      : Intel(R) Xeon(R) Gold 6212U CPU @ 2.40GHz
stepping        : 7
microcode       : 0x1
cpu MHz         : 2399.998
cache size      : 4096 KB
physical id     : 0
siblings        : 1
core id         : 0
cpu cores       : 1
apicid          : 0
initial apicid  : 0
fpu             : yes
fpu_exception   : yes
cpuid level     : 13
wp              : yes
flags           : fpu vme de pse tsc msr pae mce cx8 apic sep mtrr pge mca cmov pat pse36 clflush mmx fxsr sse sse2 ss syscall nx pdpe1gb rdtscp lm constant_tsc arch_perfmon rep_good nopl cpuid tsc_known_freq pni pclmulqdq ssse3 fma cx16 pcid sse4_1 sse4_2 x2apic movbe popcnt tsc_deadline_timer aes xsave avx f16c rdrand hypervisor lahf_lm abm 3dnowprefetch invpcid_single ssbd ibrs ibpb stibp ibrs_enhanced fsgsbase tsc_adjust bmi1 avx2 smep bmi2 erms invpcid mpx avx512f avx512dq rdseed adx smap clflushopt clwb avx512cd avx512bw avx512vl xsaveopt xsavec xgetbv1 pku ospke avx512_vnni md_clear arch_capabilities
bugs            : spectre_v1 spectre_v2 spec_store_bypass swapgs taa itlb_multihit mmio_stale_data retbleed eibrs_pbrsb gds
bogomips        : 4799.99
clflush size    : 64
cache_alignment : 64
address sizes   : 46 bits physical, 48 bits virtual
power management:
ネットで調べたベンチマークだと、「Xeon E5 v4」がGeekBenchiで821で、「Intel(R) Xeon(R) Gold 6212U CPU @ 2.40GHz」がGeekBenchiで1087だそうです。どちらもシングルスレッドです。
25%ぐらい早いですね。しかも3Coreのサーバです。結構な違いに思えます。
SysBenchiしてみた
折角なのでサーバにsysbenchをインストールしてベンチマークしてみます。
ただ、稼働中のサーバで新サーバは思いっきり稼働中です。旧サーバはほぼ停止状態です。
ベンチマークソフトは馴染みがないのですが、影響するんだろうか?分からないので忘れます(^_^;
CPUを計測
まずは東京リージョンの旧サーバです。
[root@sak-tk2 ~]# sysbench --test=cpu run
WARNING: the --test option is deprecated. You can pass a script name or path on the command line without any options.
sysbench 1.0.17 (using system LuaJIT 2.0.4)

Running the test with following options:
Number of threads: 1
Initializing random number generator from current time


Prime numbers limit: 10000

Initializing worker threads...

Threads started!

CPU speed:
    events per second:   804.73

General statistics:
    total time:                          10.0008s
    total number of events:              8051

Latency (ms):
         min:                                    1.14
         avg:                                    1.24
         max:                                    7.15
         95th percentile:                        1.32
         sum:                                 9991.63

Threads fairness:
    events (avg/stddev):           8051.0000/0.00
    execution time (avg/stddev):   9.9916/0.00
次は新サーバの石狩リージョンです。
[root@rb-srv ~]# sysbench --test=cpu run
WARNING: the --test option is deprecated. You can pass a script name or path on the command line without any options.
sysbench 1.0.20 (using system LuaJIT 2.1.0-beta3)

Running the test with following options:
Number of threads: 1
Initializing random number generator from current time


Prime numbers limit: 10000

Initializing worker threads...

Threads started!

CPU speed:
    events per second:  1079.93

General statistics:
    total time:                          10.0008s
    total number of events:              10802

Latency (ms):
         min:                                    0.91
         avg:                                    0.93
         max:                                    2.40
         95th percentile:                        0.94
         sum:                                 9996.09

Threads fairness:
    events (avg/stddev):           10802.0000/0.00
    execution time (avg/stddev):   9.9961/0.00
東京リージョンは1秒間に804.73回、石狩リージョンは1秒間に1079.93回処理できた様です。
比較は74.5%なので予想通り?、石狩リージョンの方は34%程早い様です。
メモリを測定
次は、メモリの速度を測定してみます。
まずは東京リージョンの旧サーバです。
[root@sak-tk2 ~]# sysbench --test=memory run
WARNING: the --test option is deprecated. You can pass a script name or path on the command line without any options.
sysbench 1.0.17 (using system LuaJIT 2.0.4)

Running the test with following options:
Number of threads: 1
Initializing random number generator from current time


Running memory speed test with the following options:
  block size: 1KiB
  total size: 102400MiB
  operation: write
  scope: global

Initializing worker threads...

Threads started!

Total operations: 33565315 (3355659.32 per second)

32778.63 MiB transferred (3277.01 MiB/sec)


General statistics:
    total time:                          10.0002s
    total number of events:              33565315

Latency (ms):
         min:                                    0.00
         avg:                                    0.00
         max:                                    5.96
         95th percentile:                        0.00
         sum:                                 4202.20

Threads fairness:
    events (avg/stddev):           33565315.0000/0.00
    execution time (avg/stddev):   4.2022/0.00
次は新サーバの石狩リージョンです。
[root@rb-srv ~]# sysbench --test=memory run
WARNING: the --test option is deprecated. You can pass a script name or path on the command line without any options.
sysbench 1.0.20 (using system LuaJIT 2.1.0-beta3)

Running the test with following options:
Number of threads: 1
Initializing random number generator from current time


Running memory speed test with the following options:
  block size: 1KiB
  total size: 102400MiB
  operation: write
  scope: global

Initializing worker threads...

Threads started!

Total operations: 48764259 (4875576.71 per second)

47621.35 MiB transferred (4761.31 MiB/sec)


General statistics:
    total time:                          10.0001s
    total number of events:              48764259

Latency (ms):
         min:                                    0.00
         avg:                                    0.00
         max:                                    1.17
         95th percentile:                        0.00
         sum:                                 4461.37

Threads fairness:
    events (avg/stddev):           48764259.0000/0.00
    execution time (avg/stddev):   4.4614/0.00
東京リージョンは1秒間に3277.01 MiB/sec、石狩リージョンは1秒間に4761.31 MiB/secでした。
石狩リージョンの方が45%程早い様です。随分な差ですね。。
File IOを測定
次は、File IOを測定してみます。
まずは東京リージョンの旧サーバです。
[root@sak-tk2 x]# sysbench --test=fileio --file-total-size=1G --file-test-mode=rndrw run
WARNING: the --test option is deprecated. You can pass a script name or path on the command line without any options.
sysbench 1.0.17 (using system LuaJIT 2.0.4)

Running the test with following options:
Number of threads: 1
Initializing random number generator from current time


Extra file open flags: (none)
128 files, 8MiB each
1GiB total file size
Block size 16KiB
Number of IO requests: 0
Read/Write ratio for combined random IO test: 1.50
Periodic FSYNC enabled, calling fsync() each 100 requests.
Calling fsync() at the end of test, Enabled.
Using synchronous I/O mode
Doing random r/w test
Initializing worker threads...

Threads started!


File operations:
    reads/s:                      1468.02
    writes/s:                     978.68
    fsyncs/s:                     3142.65

Throughput:
    read, MiB/s:                  22.94
    written, MiB/s:               15.29

General statistics:
    total time:                          10.0101s
    total number of events:              55841

Latency (ms):
         min:                                    0.00
         avg:                                    0.18
         max:                                   13.67
         95th percentile:                        0.63
         sum:                                 9948.07

Threads fairness:
    events (avg/stddev):           55841.0000/0.00
    execution time (avg/stddev):   9.9481/0.00
次は新サーバの石狩リージョンです。
[root@rb-srv x]# sysbench --test=fileio --file-total-size=1G --file-test-mode=rndrw run
WARNING: the --test option is deprecated. You can pass a script name or path on the command line without any options.
sysbench 1.0.20 (using system LuaJIT 2.1.0-beta3)

Running the test with following options:
Number of threads: 1
Initializing random number generator from current time


Extra file open flags: (none)
128 files, 8MiB each
1GiB total file size
Block size 16KiB
Number of IO requests: 0
Read/Write ratio for combined random IO test: 1.50
Periodic FSYNC enabled, calling fsync() each 100 requests.
Calling fsync() at the end of test, Enabled.
Using synchronous I/O mode
Doing random r/w test
Initializing worker threads...

Threads started!


File operations:
    reads/s:                      1882.49
    writes/s:                     1254.99
    fsyncs/s:                     4025.36

Throughput:
    read, MiB/s:                  29.41
    written, MiB/s:               19.61

General statistics:
    total time:                          10.0064s
    total number of events:              71558

Latency (ms):
         min:                                    0.00
         avg:                                    0.14
         max:                                   63.04
         95th percentile:                        0.44
         sum:                                 9962.58

Threads fairness:
    events (avg/stddev):           71558.0000/0.00
    execution time (avg/stddev):   9.9626/0.00
見てみます。
読み込み速度は、東京リージョンが22.94MiB/sで、石狩リージョンが29.41MiB/sで、石狩リージョンの方が28%程早い様です。
書き込み速度は、東京リージョンが15.29MiB/sで、石狩リージョンが19.61MiB/sで、石狩リージョンの方が28%程早い様です。
まとめ
手元の東京リージョンのサーバと、石狩リージョンのサーバで比較してみました。
事前情報の通り、石狩リージョンのサーバの方が、おそらく新しくCPUは25%程早いだろう?と予想はしていました。石狩リージョンの方がサーバ自体が新しいと予想し、メモリIOなんかも石狩リージョンの方が早いのでは?と思ってました。
サンプル数が少ないので、目安にしかならないとは思いますが、以下の感じでした。
| ベンチマーク項目 | 東京リージョン | 石狩リージョン | 比較 |
| ネットワークレイテンシー | 4.302ms | 21.230ms | -80% |
| ネットワーク転送速度 | 94.7Mbps | 93.95Mbps | -1% |
| CPU | 804.73回/sec | 1079.93回/sec | +34% |
| メモリ | 3277.01 MiB/sec | 4761.31 MiB/sec | +45% |
| File I/O Read | 22.94MiB/sec | 29.41MiB/sec | +28% |
| File I/O Write | 15.29MiB/sec | 19.61MiB/sec | +28% |
比較すると、ネットワークレイテンシー(反応速度)は、東京リージョンが極端に早いです。
ネットワーク転送速度は誤差レベルで同じぐらいでした。
サーバ自体のCPU、メモリ、Disk等の速度は石狩リージョンの方が早かったです。
上記の事から、私は石狩リージョンの方が安いし、良さそうかなと思いました。
ただし、ネットワークの反応速度が必要な場合は、東京が良いと思います。
東京リージョンで、石狩リージョンと同じサーバだったら、迷わず東京リージョンかな?
コメント